|
|
A Web Quest for 6th Grade (Math) Designed by Georgia Dalakouras Introduction | Task | Process | Evaluation | Conclusion | Credits | Teacher
Page
Have you ever wondered what
peopleÆ─¶s favorite ice cream flavor is?
How about their favorite sport or television show? If so, this is your chance to
explore. You will be able to
conduct a survey and analyze the data from the survey on a topic of your
choice. You will design your own survey and
conduct research. This project
involves writing a survey, collecting firsthand data, analyzing data and preparing
statistics, presenting the data and statistics in both graphic and written
form. In addition, you will use the data you collect
and analyze to create a Power Point presentation to share the information you
found with the class. Part A:
ORGANIZATION AND BRAINSTORMING 1. Create a bubble map and outline of questions with possible
responses, which contains the topic to be surveyed, 5 survey questions to be
answered, and at least 5 categories of responses for each question. 2. Submit your outline to your teacher for approval. Part B:
PUTTING TOGETHER THE SURVEY 1. Your survey should be typed and
double-spaced. You must have two
copies of your survey. One for
your tally marks and one for your teacher. 2. Include on your survey: your name, topic, and
questions to be surveyed, and categories of responses for each question. Part
C: CONDUCTING YOUR
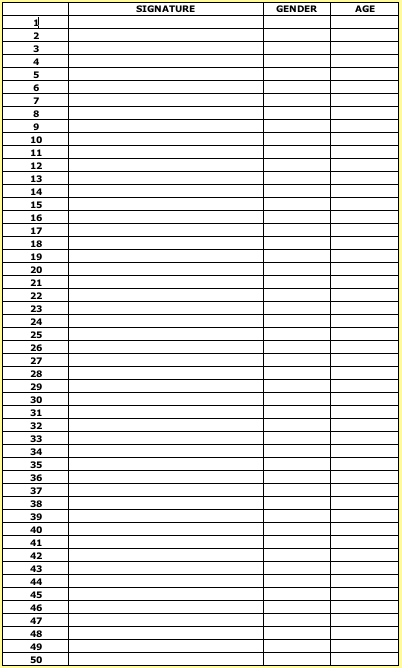
SURVEY-COLLECTING DATA 1. You mush collect data from at least 50
people. You must create a signature page. Each person surveyed should sign
their name and write their age and gender. 2. You must submit the data showing responses from
the 50 people you surveyed.
Attach your data and signature page to your final project. Part D:
ORGANIZING DATA 1.
Complete the
following activities to practice your spreadsheet skills: ¼ģ
Spreadsheets
Worksheet ¼ģ
Using
Spreadsheets to Display Infinite Sequences ¼ģ
View sections A
through D in the Excel
Tutorial ¼ģ
Complete the Spreadsheet Safari 2.
You must record the
data collected on a spreadsheet ¼ģ
Steps to create your spreadsheet 3.
You must submit
your records, spreadsheet, etc., with your final project Part
E: CREATING GRAPHS 1. Translate your data into 2 types of graphs. You may choose from circle, bar, or
double bar graph. Each graph
must represent a different question and you do a total of two graphs. You do not need to do a graph for
each question. 2. Your two graphs must be submitted with your final
project. Part
F: DESCRIBING THE POPULATION
SURVEYED AND ANALYZING DATA 1. You must analyze the data you collected through
your survey project. Try to
incorporate ratios, percents, and fractions when analyzing your data for each
question. 2. In the description of the population you must
include: a. % Males surveyed b. % Females surveyed c. Average age of people surveyed d. Group surveyed: varied (multiple ages, adults and
children) or specific (boys only, girls only, adults only, 6th
graders on team 2, etc.) Part
G: POWER POINT PRESENTATION 1. Story board -You must complete a story board for each Power
Point Slide 2. View section A in the Power Point Tutorial 3. In your presentation you will create at least 8
slides: a. One title slide-include your name and topic b. One slide to describe the population of the
people you surveyed c. Five slides-one for each question d. Each slide should include your question and what
you found regarding each question.
e. Two of those slides should also include the
graphs created in excel. f. One slide for your conclusion. Talk about what you would do to
improve your survey and what you learned from the survey. THE
FINAL PROJECT CHECKLIST
At the conclusion of this project you
will have learned how to gather, organize and analyze data. In addition, you will have learned
how to represent the data you found with various types of graphs with the use
of Excel and how to use a presentation tool such as Power Point to present
all of the data you found. Now that you have completed the survey
project is there anything that you would have done different? Would you have chosen the topic you
chose to conduct your survey?
How about the people you chose to survey? Or the choices you gave for each question? Bubble Map
Using a spreadsheet
is a wonderful way to work problems such as this one since the computation is
repetitive and can be accomplished very quickly and efficiently using your
computer! Step 1: In A1: Write the title of this project,
"Pondering a Penny!" If you wish to make the title larger (as in
the sample) HIGHLIGHT THE CELL FIRST THEN go to FORMAT, CELLS, FONT and drag
down to size and highlight 14. Notice that the row is too narrow to
accommodate type this large. Place the cursor at the top of the column
between A and B and drag the line dividing the columns to the right. Step 2: In A3: Type in the word, "Day".
HIGHLIGHTING THE CELL FIRST and then going to FORMAT, CELLS, down to
ALIGNMENT, and choosing CENTER can center this. In B3 write the title of this column, "Dollar
Amount." Step 3: In A4: type in the
number, 1. This represents day one of our problem. We do not need to type in
the rest of the numbers in this column since we can introduce a formula to
give us the rest of the numbers. Step 4: In A5: type in the
formula that will add one to the number in A4-remember that we want to use a
cell to our first number. Write the formula here:_________________________________________________ Step 5: Click on the cell
containing the formula (A5) and drag down to row 34. Notice that when you
release the mouse all of these cells are now highlighted. Go to EDIT and drag
to Fill Down. What has happened in column A?______________________________________________________ Step 6: Now we move on to
the column titled "Dollar Amount"-column B. In B4 enter the number
0.01. Now HIGHLIGHT THIS CELL AND THEN go to FORMAT, CELLS and drag down to
Number. Among your choices here is "Currency." Choose currency and
maintain the default value of 2 (since money is written to two decimal
places.) What has happened to the number we wrote in B4?_______________________________________ Step 7: Now click on cell
B5: Write a formula that will double the amount of money we have in cell B4.________________________________________ Step 8: We wish to repeat
this formula to the remaining cells in column B until we get to row 34. How
did we do this in column A?___________________ ______ Highlight B4- B34, EDIT, FILL DOWN
Let's
examine the sequence: 1, 1, 2, 3, 5, 8, 13 ... This sequence of numbers was
first recognized by an Italian mathematician, Fibonacci. Can you discover how
this sequence is formed? Write your reasoning here: _________________________ Do you think you might be able to predict how large the
50' term of this sequence might be? How about the 100"' term? Write your
estimates here________________________________________ We can develop a spreadsheet to help us make child's
play out of this tedious task! Just follow these easy steps: First, we will
prepare the paper so that we know whose work it is and we have column titles: 1.
In cell Al write your name (first and last) 2.
In cell C 1 write
your class 3. In
cell A2 write
the word "Term"- Highlight the cell first and then go to FORMAT,
CELLS- ALIGN TO CENTER 4. In
cell B2 write
the work "Fibonacci #" Æ─ņHighlight the cell first and then
go to FORMAT, CELLS - ALIGN TO CENTER Now
let's look at setting up the formulas: 1.
In cell A3 write
the number 1 since this is the first term on the sequence. 2. In cell B3 write the number 1
since this is the first number in the Fibonacci Sequence. 3. Cell A4 will hold the second term of the
sequence and it requires a formula that adds one to the cell above it. Write
a formula that will increase the term in cell A3 by one._____________________________________________________ Enter
this formula on your spreadsheet in cell A4. 4. Cell B4 contains the number
"1", the same number that was in cell B3. Enter the number
"1" in cell B4. 5.
Column A now
has a formula that can be repeated either by typing in new formulas into each
succeeding cell or by using the function, FILL DOWN. This can be found
under EDIT. Highlight
the cell that contains the formula you wish to duplicate, hold down the mouse
and drag down until you have the number of terms you want. In this case you
want to find the 100' term so you will drag down to row 103 since you started
your first term in row 3. Column A is now highlighted. Under EDIT go to Fill Down. Describe what has
happened on your spreadsheet. 6. We
must still put a formula in column B for the Fibonacci Number. How would
we get to the third Fibonacci number? What is the rule for this sequence? 7.
Write that formula in cell B5. 8.
We now have a formula that we can use to find the rest of the numbers in this
infinite sequence. Again, highlight the cell that has the formula you wish to
duplicate. Hold down the mouse and drag down until you have the number of
numbers you want. In
this case you want to find the 100' term so you will drag down to row 103
since you started your first term in row 3. What do you notice on the
spreadsheet? What is the 50th term of the Fibonacci Sequence? What is the 100`I' term of
the Fibonacci Sequence? Step
9: Do the same thing-hold down the mouse on cell B5, drag it down to B34 and
release it. Under EDIT drag to Fill Down. What happened to the
numbers at the end of the column? This tells us that we need to make the column wider
because the numbers are too big to fit in the column at its current width. Go
to the top of the spreadsheet (between the B and the C). What happens to the
solid cross when you get between these letters? Draw that symbol here:_____________________ . Hold down the
mouse and extend your column in the direction of the right arrow until all of
your numbers appear in column B. How much
money do you have after 31 days? ______________________
1.
Go to VIEW 2.
Select HEADER and FOOTER 3.
Click on CUSTOMIZE HEADER 4.
Type your NAME, DATE, and BLOCK in the first box. 5.
Click on OK 6.
Click on OK again
¼ģ
This
survey project is an excellent project for students in grade six to complete
once they have completed units in percents, fractions, and ratios. ¼ģ
Students
can choose a topic that interests them to explore. ¼ģ
Students
will need to brainstorm with the teacher some ideas of an appropriate survey
topic. ¼ģ
Once
students have decided on a topic they will need a couple of days to outline
five questions and possible responses for each questions. It is important
that the teacher approves the questions the students choose. ¼ģ
Once
the questions are approved on the question outline, students can type the
questions and begin to conduct their survey. ¼ģ
Students
will need a week to survey fifty people
The calendar
below is an example of the amount of time to allow for each component of the
project
A
special thanks to Barbara Wolke of the Glenveiw Northbrook School District
for her role in creating the online survey project. Without her help,
this WebQuest would not have been possible. In
addition, I would like to acknowledge The WebQuest Page where the
template for this lesson was obtained. Atomic
Learning Website. 4 February 2005. Excel X for Mac. http://www.atomiclearning.com/excel_xx Atomic
Leaning Website. 4 February 2005. Microsoft Power Point for Mac http://www.atomiclearning.com/powerpoint_x2 Think
Quest Website. 8 March 2005. St. Peter and Paul School, Naperville, IL. 2001 http://library.thinkquest.org/J0110054/index.html Microsoft
Office Online. 8 March 2005. Clip Art and Media http://office.microsoft.com/clipart/default.aspx?lc=en-us&cag=1
Last updated on March 8, 2005. Based on a template from The WebQuest Page |
|||||||||||||||||||||||||||||||||||||||||||||||||||||||||||||||||||||||||||||||||||||||||||||||||||||||||||||||||||||||||
|
|
|
|||||||||||||||||||||||||||||||||||||||||||||||||||||||||||||||||||||||||||||||||||||||||||||||||||||||||||||||||||||||||


 PIE
GRAPHS
PIE
GRAPHS